We do the research, you get the alpha!


Disclaimer
The views and opinions expressed by the author are for informational purposes only and do not constitute financial, investment, or other advice.
$66,457.00
-0.80%$3,467.06
-1.66%$586.51
-0.06%$176.96
-0.62%$0.629115
4.22%$0.999934
-0.04%$3,465.68
-1.63%$0.133543
-1.39%$6.98
0.62%$0.418385
-1.82%$30.32
-0.98%$0.134058
1.22%$66,393.00
-0.95%$0.0000173
-0.79%$13.84
-1.73%$5.99
-1.69%$373.14
-2.77%$5.92
-0.28%$7.67
-2.46%$73.38
1.01%$5.84
1.52%$0.00001268
4.54%$3,611.88
-1.75%$0.536494
-2.94%$10.00
0.90%$0.178355
2.96%$23.73
-4.12%$0.999881
-0.02%$7.07
-3.23%$1.27
-6.11%$0.104983
1.66%$161.24
-0.03%$0.887047
-1.23%$1.82
0.77%$0.781441
-4.93%$2,785.12
1.46%$2.58
0.02%$4.52
-0.64%$6.46
-2.51%$0.069547
-1.69%$0.092794
0.05%$25.29
-0.33%$6.29
-0.24%$341.25
5.24%$40.05
-1.93%$1.55
-1.90%$0.02927086
-0.30%$1.88
-3.27%$31.64
1.23%$0.810312
-3.45%$0.999395
-0.14%$0.00002846
-1.30%$3,864.33
-2.09%$0.200791
-3.20%$3,510.57
-1.79%$0.00018754
-0.03%$3,602.80
-1.99%$1.16
-3.16%$4.73
-1.41%$1.75
-7.21%$1.50
0.38%$10.12
-0.33%$0.01422049
-1.40%$1.002
-2.25%$93.69
-2.27%$0.49571
-1.24%$0.02855267
1.37%$0.998316
1.09%$0.131447
-2.48%$0.355881
2.22%$1.43
-7.80%$6.41
-9.07%$0.377116
-1.57%$0.145679
-1.66%$3,446.58
-2.15%$73.23
-1.12%$1.24
-2.03%$7.60
-0.44%$0.634968
2.33%$212.60
-1.00%$9.86
0.29%$34.55
-3.14%$28.28
-5.88%$6.14
-0.06%$0.01789867
-6.90%$0.02435108
-0.20%$0.594213
1.47%$45.02
-1.07%$3,526.17
-1.72%$5.27
3.41%$11.04
-1.60%$0.01986229
-1.47%$0.877756
6.07%$0.501728
13.21%$0.00000087
-1.05%$11.71
1.06%$1.34
-4.01%$3.35
-3.70%$37.61
-2.96%$0.00861299
16.75%$0.769142
-0.59%$0.582307
-9.48%$2.23
-2.01%$0.328245
-0.77%$2.33
-0.06%$3,723.61
-1.95%$0.999353
-0.04%$0.00000199
-4.06%$0.00003508
0.00%$1.23
-1.02%$0.161379
-3.62%$3,446.24
-1.99%$0.177635
-8.03%$0.996653
-0.01%$4.12
-2.93%$2.21
-5.94%$0.339414
-1.25%$0.070569
-1.62%$2.36
2.85%$238.87
-3.90%$0.09063
-1.83%$0.531436
-5.67%$0.999658
0.04%$0.00871987
-0.14%$2,413.27
0.21%$0.533992
-2.81%$1.79
-2.68%$0.171828
-1.26%$3,686.21
-1.67%$0.31882
-2.87%$0.00000027
4.54%$9.72
-3.25%$0.821839
0.14%$0.14406
0.00%$0.01197731
-0.75%$4.83
-4.30%$3,782.95
-1.56%$1.23
-2.97%$0.07436
-1.79%$15.60
-1.67%$0.397
-4.85%$1.001
0.10%$0.679375
-6.06%$72.33
-0.05%$0.00008762
1.62%$0.070429
0.57%$0.863045
-0.97%$0.539627
-9.10%$2.01
-1.17%$30.33
-1.32%$0.03039175
0.76%$25.75
1.23%$2,409.05
0.32%$0.412563
-0.83%$0.04668389
-0.76%$0.00636358
1.23%$1.057
-3.37%$0.00000043
0.04%$1.009
-1.56%$0.00416507
-0.66%$0.993525
-0.59%$3,586.15
-1.67%$0.079002
-0.75%$0.204179
-3.55%$0.471991
-0.75%$3.98
-0.47%$2.39
-11.06%$3.25
-5.16%$0.826124
-0.48%$0.052748
-5.34%$69.65
-1.71%$0.971154
-7.54%$0.01606948
-6.15%$0.361869
6.61%$0.567405
-5.89%$8.79
-1.03%$0.200351
-3.24%$17.06
-8.57%$1.44
-5.90%$50.22
-2.62%$0.150697
-1.79%$0.506301
-2.62%$0.618442
4.71%$0.00096072
-3.13%$21.38
-2.82%$0.718831
5.55%$27.22
0.76%$1.68
-7.91%$0.270899
-5.12%$0.01720842
-1.71%$7.49
-5.90%$0.04746531
3.71%$2.56
-1.46%$0.373477
-1.63%$0.01738858
-1.56%$0.579931
-2.27%$0.188485
-1.94%$0.03109334
-2.60%$0.00175068
-2.98%$2.64
-4.78%$3,641.44
-1.71%$1.34
-3.96%$0.00530892
1.65%$31.56
-4.01%$0.164562
-0.26%$1,333.72
-0.74%$2.02
0.14%$2.73
-0.82%$0.196556
0.72%$0.273695
-0.23%$0.719854
-3.57%$0.02770712
-1.29%$0.423056
-0.90%$0.076392
-0.48%$0.397631
0.31%$77.30
-1.59%$6.21
-2.99%$0.02869987
-0.52%$49.14
-6.24%$2.65
-1.34%$0.00546098
-0.75%$0.00086296
16.61%$0.01955823
-2.71%$66,423.00
-0.57%$2.77
-0.16%$0.31466
-4.56%$0.02119463
-1.17%$3,618.90
-1.70%$35.17
-0.52%$0.295167
-0.65%$8,423.25
12.48%$3.81
-0.33%$0.04760146
-4.87%$0.00437134
-2.27%$1.00
0.07%$0.488067
-1.77%$0.684915
-1.56%$0.14716
-3.53%$2.38
-1.40%$0.02938153
-9.51%$2.86
6.75%$32.73
-5.31%$0.552566
-6.06%$0.02336321
-2.53%$0.336992
-10.83%$0.491039
-0.60%$0.00000029
11.96%$0.088068
-3.22%
Dogecoin (DOGE) may be poised to reward long-term holders and traders if the market’s reading of the crypto tea leaves is correct. The original meme coin is headed towards what’s known in trader parlance as a “golden cross.”
What does that mean? Let’s dive into a little DOGE TA (so if lines on charts aren’t your thing, the rest of this probably isn’t for you).
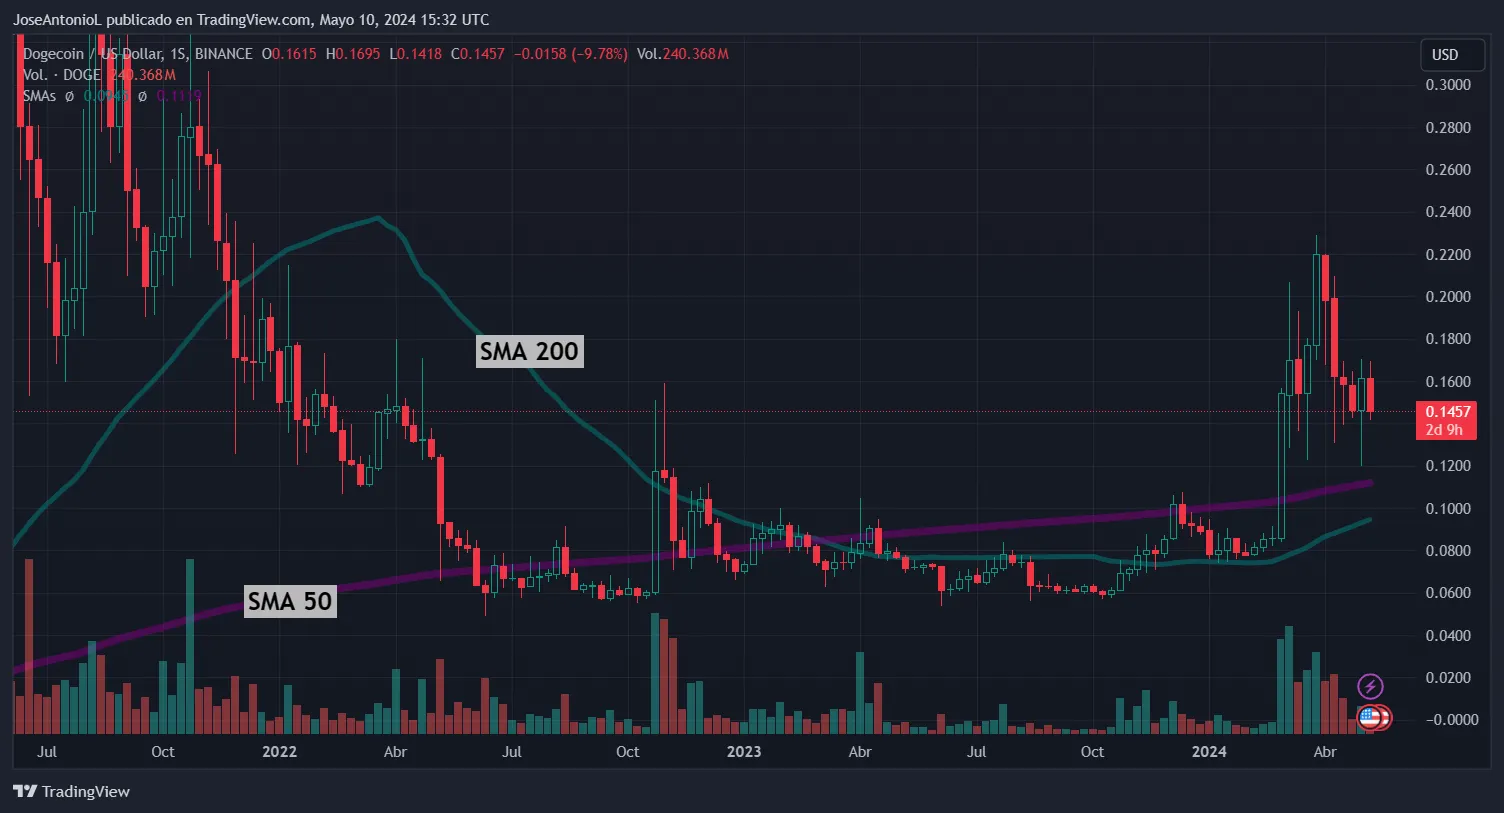
Sure, Dogecoin is down today, dipping 1.9% to a price of $0.145, but its weekly performance remains positive: DOGE is up 5% over the past seven days. If we zoom out, this upward trend persists, despite the correction experienced over the last four days.
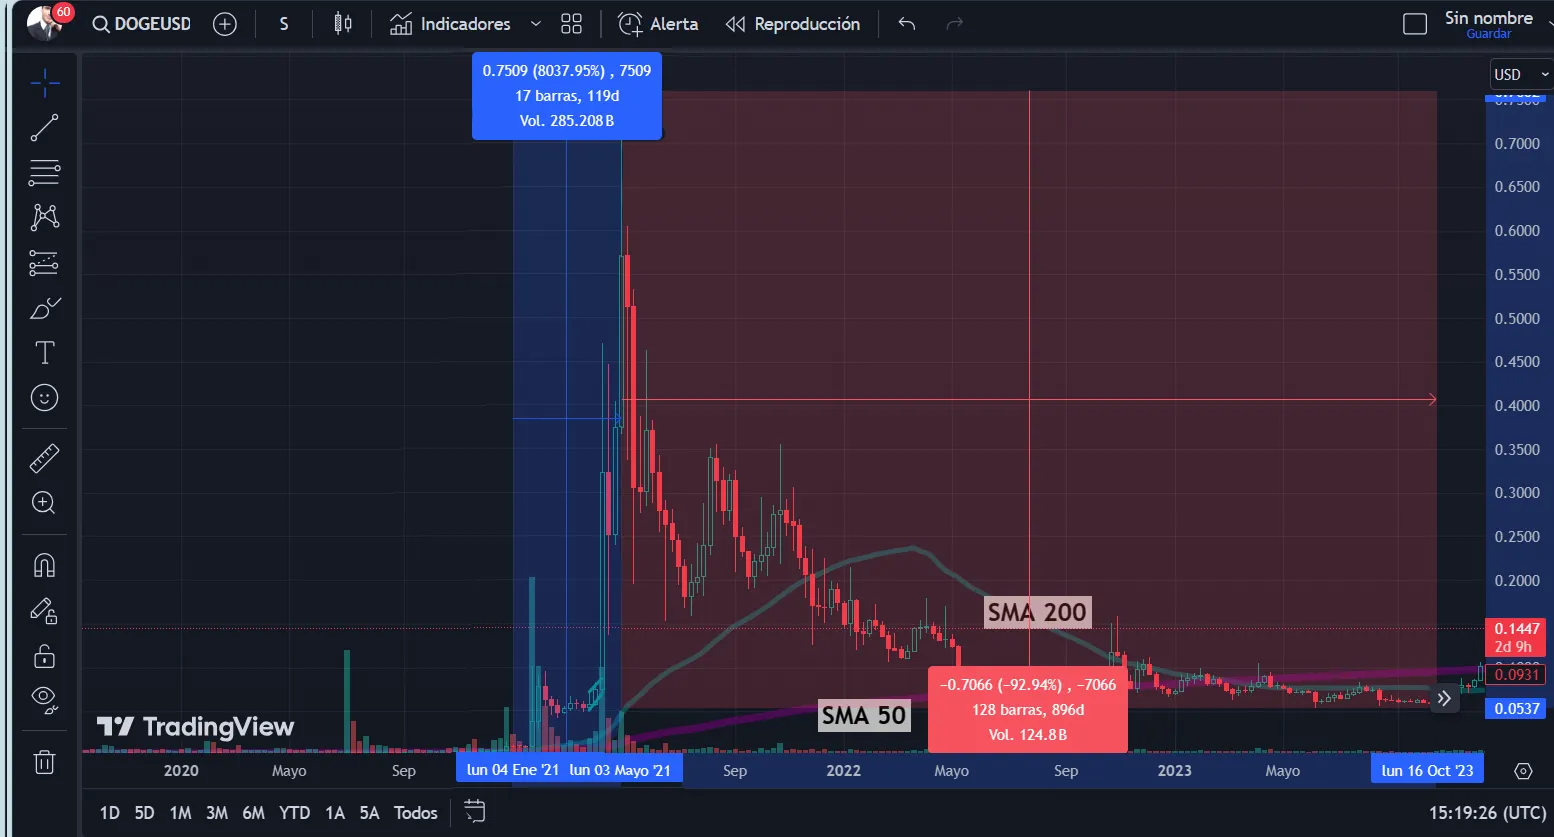
And there’s even more reason for optimism if we look a little closer: The 50-week simple moving average (SMA) of the token's spot price is currently rising and—if things keep moving in this direction—could cross above the 200-week SMA in the coming weeks. That intersection would form a golden cross—something that hasn’t happened for Dogecoin since early 2021. And that was just before DOGE went on a mega run and just four months later hit its all-time high of over $0.73 per coin.

In simple terms, the formation of a golden cross would mean that new buyers are registering gains faster than long-term holders (who had to endure the slow performance of previous days). To traders, this signals a potential bullish market trend and is often interpreted as a strong buy signal, marking the end of a bearish trend and the beginning of a bullish phase.
So how did DOGE find itself on the verge of another golden cross? The first positive sign for Dogecoin's price happened when it broke its 200-week SMA back in March, with a more than 70% spike in just one week. This movement helped boost up the SMA 200, breaking its previous flat performance. As mentioned, the impending golden cross would be the first in over three years—if it happens.
The previous golden cross, back in January 2021, happened just before buyers sent the coin from $0.0096 to an all-time high of above $0.73 in May of the same year—that’s almost an 8,000% price increase. But most of you know what happened next: that massive surge was followed by a 90% decline in the subsequent months. Dogecoin then stabilized between $0.05 and $0.10 from May 2022 and February 2024.

So what does that all mean? Well, even though this is how traders interpret such data and may often use it to help guide their decisions and behavior, it doesn’t mean any of this will happen again. So don’t break out that expensive champagne for the OG meme coin just yet.
After all, a golden cross is just one of many indicators that traders look at, and prudent investors will consider risk management strategies and other factors.
For example, and perhaps most importantly, the market as a whole was in a completely different place in 2021. Macroeconomic conditions have changed, and geopolitical turmoil has market participants currently feeling panicky. So when it comes to trying to time the market for max gains, it’s important to keep in mind that while history might often rhyme, rarely does lightning strike twice.
Disclaimer
The views and opinions expressed by the author are for informational purposes only and do not constitute financial, investment, or other advice.


